


Photo by John Thomas on Unsplash
Flights Delay Prediction
Delays in Flight cause extreme planning failure & a loss of about $30B every year. It doesn't only trouble the passengers but also disrupts many other


You must have faced flight delays ever in your life if you are a frequent flight traveller. This might have caused you a lot of trouble, especially when you are running on a tight or busy schedule. To address the same problem my team - Aryan Bakle, Aryan Saxena and me have prepared this project for prediction of flight delays on India's Busiest air Route: DEL to BOM
We started off with some research. We observed that on this route 5 major airlines - SpiceJet, Vistara, Indigo, Go First and AirIndia are operating approx. 36 flights daily. Data Source - SkyScanner
Using Selenium and Python we scraped the data for all the flights and their delay history for the past 100 days. Source : FlightRadar24 The above method gave us very raw data with tones of missing values and non-segregated data.
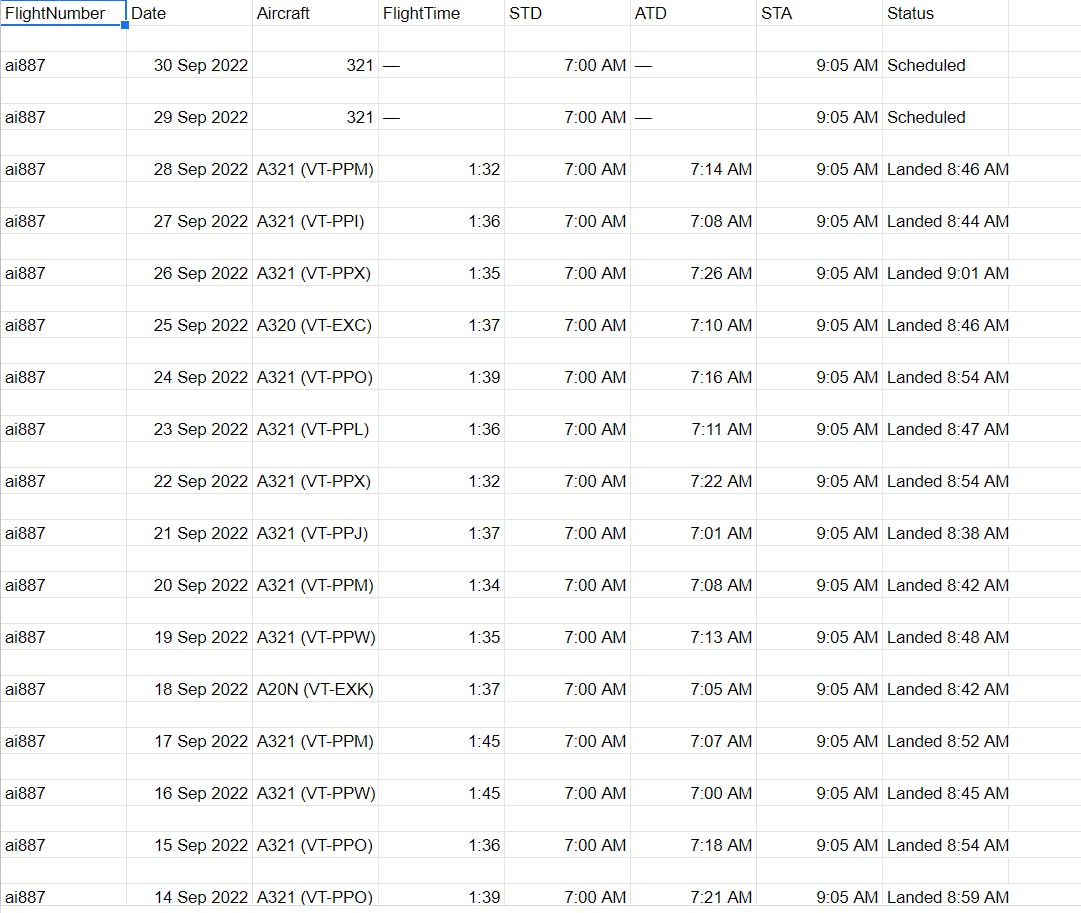
After cleaning manually, here is what we came up with -
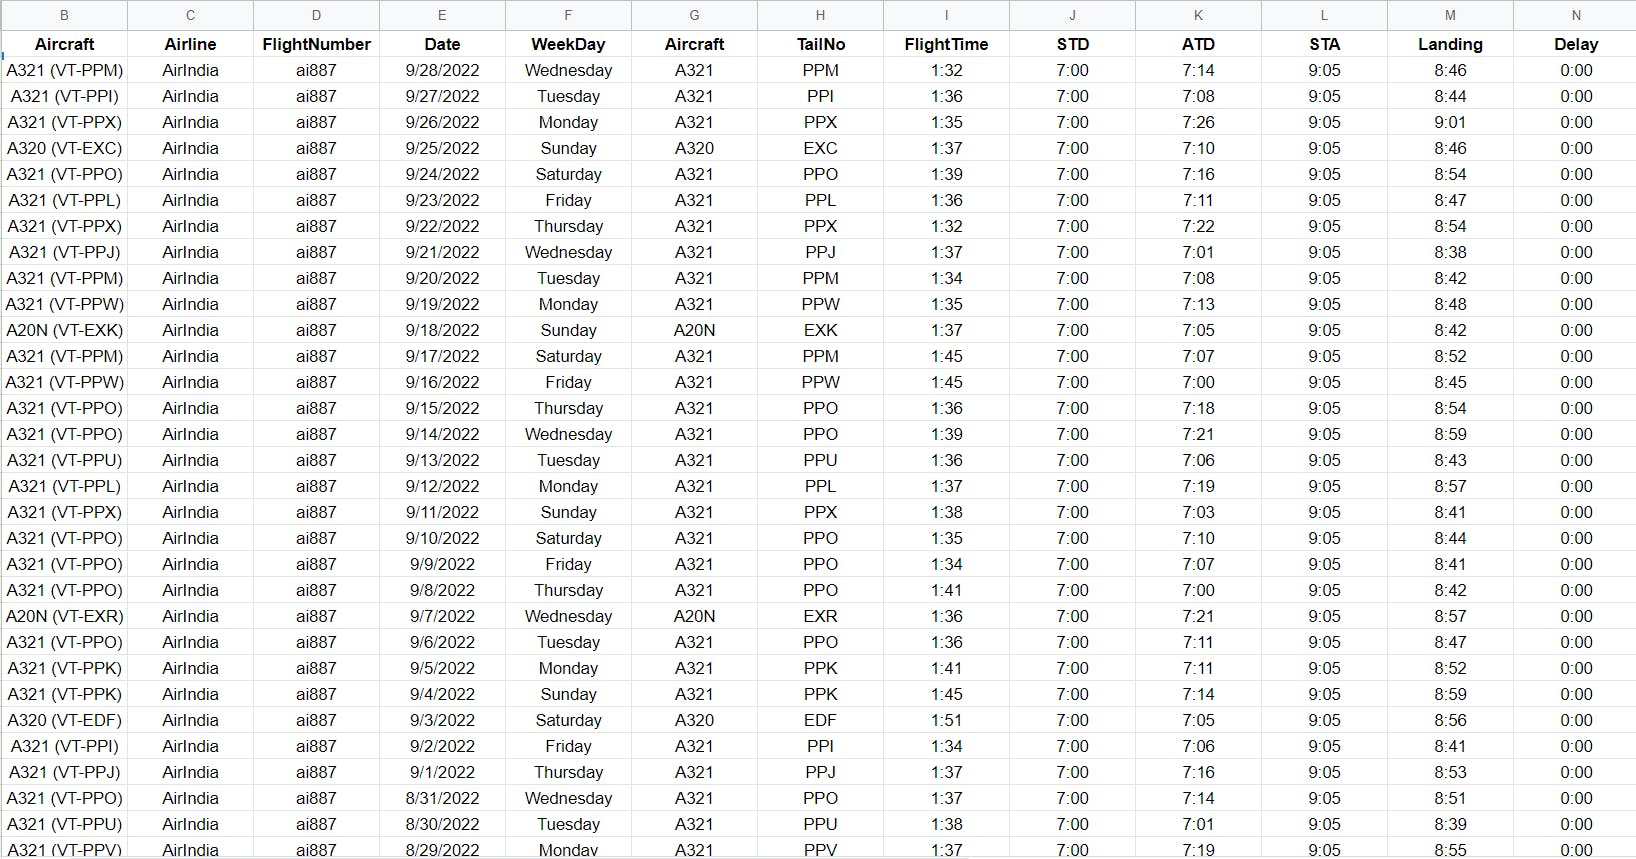
After doing some basic measures of central tendency, here's what we came up with -
- On average, 20% of total flights were delayed with an average delay time of 27 minutes. (not much)
- The maximum delay was 327 minutes ~ 5 hours for Flight number SG8169 (SpiceJet)
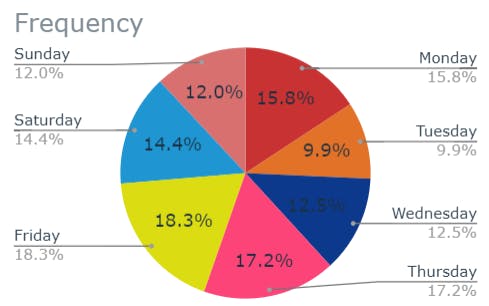
- From the past data, we saw that the maximum flights were delayed on Thursdays and Fridays. Maybe because people travel more on weekends than weekdays, flights were less booked.
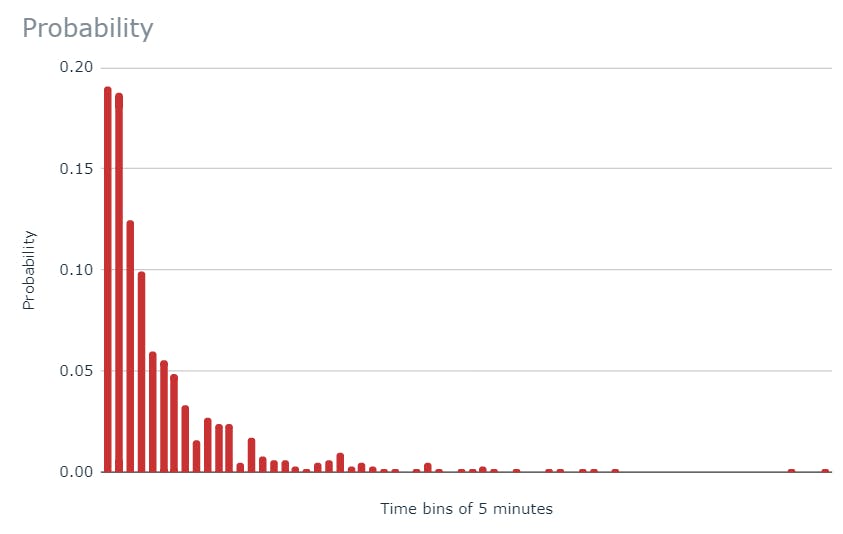
Probability Distribution for flights delay
We segregated the cleaned sheet into multiple sheets, specific for each airline and flight number. We got a total of 53 individual excel sheets for analysis. [Cheers to our team]
Later we tried Logistic regression on our dataset to check if a flight (based on the number and past history) is delayed or not. Here's the confusion Matrix of our model
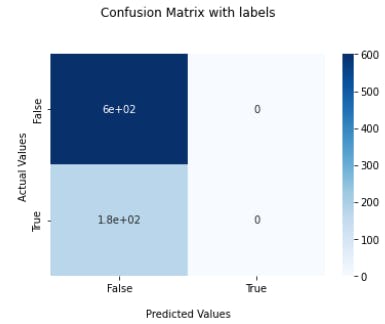
We see that there were no predicted true values. This might be because we did the analysis on past data i.e. identifying patterns, not the actual factors causing flight delays i.e. weather conditions, delays due to passenger's arrival time, technical issues, airline's carelessness etc. Our logistic regression model score was 0.7747 which I think is quite enough. Here's our google colab sheet - %[colab.research.google.com/drive/17eTmUZG65M..
In the end, we created a dashboard in google sheet where based on flight and airline history, The system was able to display the probability of that particular flight being delayed more than a threshold time input by the user. For example - Analysis for Go-First Flight No. G8336
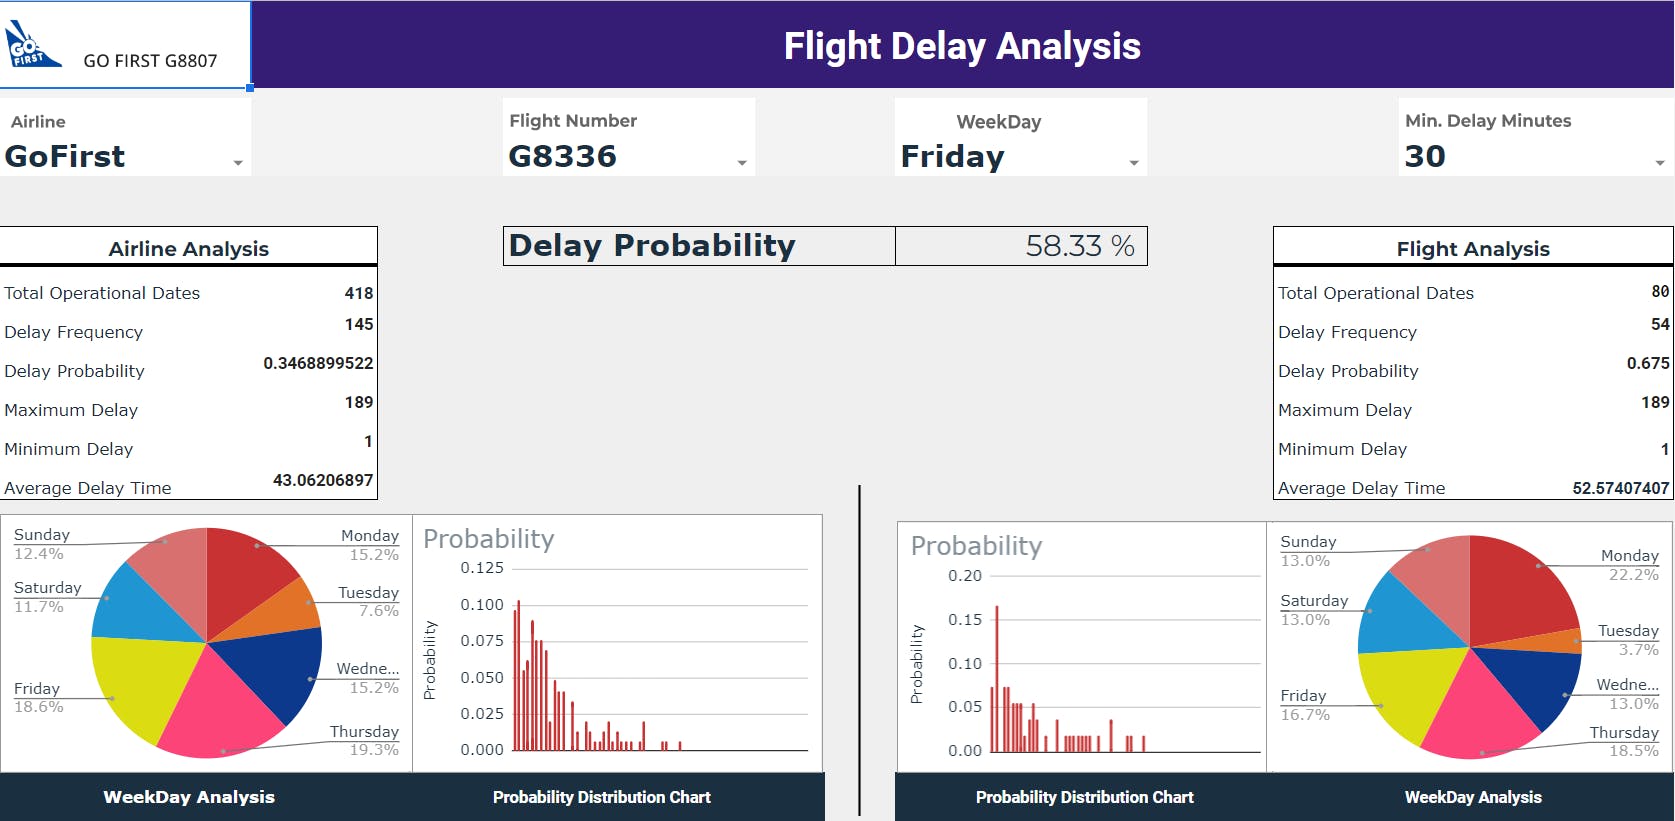
We will get all the analysis of airline and flight numbers. In this picture, the Probability of this flight for 30 minutes delay is 58.33% on Friday.
Thanks to our mentors Saurabh Mahajan, Mathew George and Vishrut Patel from Atria University for their guidance throughout the project.
Do let me know in the comments for the scope of further improvements.