
A young aspiring Data Scientist, who love to build AI and ML applications, that can contribute as a solution in real world problems. I started my coding journey in grade 8, since then I have developed solutions to many organizations.
Machine Learning and Data Science are all about playing with numbers. In this blog, I'll be covering some basic mathematical functions/terms that can help you in data analysis.
Logarithm
Imagine you have to visualize the following table
Company | Revenue |
Tesla | 31 |
Uber | 11 |
Amazon | 386 |
Jindal Steel | 4.7 |
Axis Bank | 5.6 |
Vedanta | 11.3 |
Plotting this through a bar plot, this is what we'll get
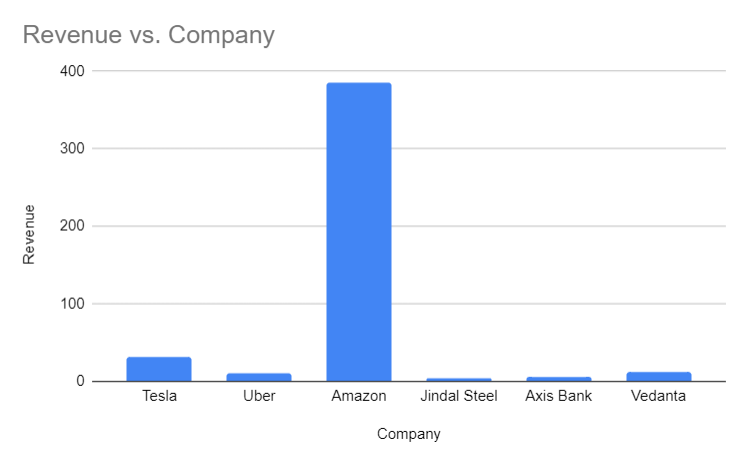
We can see that Amazon have such a high revenue that it is making it difficult to read the revenue for Jindal Steel and Axis Bank. So what we do now, here comes the concept of log. The Log is the inverse of an exponent. In the given equation -

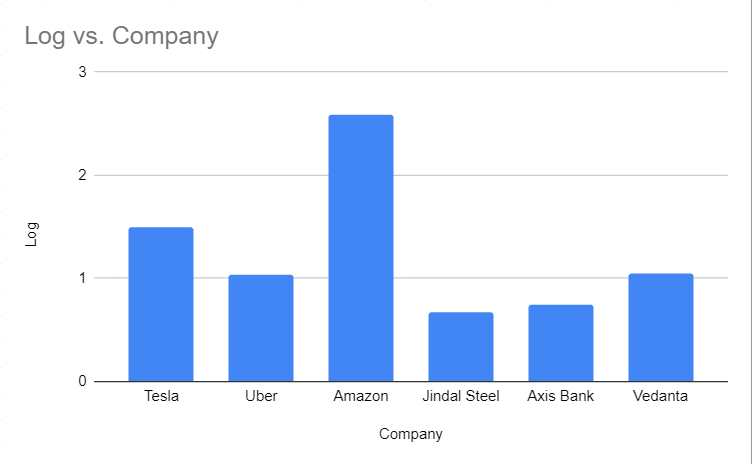
this means that b raised to the power c gives us a*,* where b is the base. The common base used is a base of 10. So in the above data, if I add a column for log base 10, this is what we'll get
Company | Revenue | Log (base 10) |
Tesla | 31 | 1.491361694 |
Uber | 11 | 1.041392685 |
Amazon | 386 | 2.586587305 |
Jindal Steel | 4.7 | 0.6720978579 |
Axis Bank | 5.6 | 0.748188027 |
Vedanta | 11.3 | 1.053078443 |
We can see that in the log column, the numbers are very much comparable so as its plot, we can clearly see the difference in revenue of the companies in much better way than the above.
In the log, every consecutive number is base times greater than the preceding one, for example, log5125 is 10 times greater than log525.
Practical examples include Earthquakes, where on a Richter Scale 5 is 10 times more powerful than 4.
Mean and Deviations
Consider the following data on salaries for employees -
Employee Name | Salary (in USD) |
Jack | 1678.3 |
Alan | 2242.9 |
Kelvin | 998.8 |
Jake | 1938.6 |
Elly | 1200.4 |
We can say that the average salary of a company is 1611.8 USD, but there is a huge difference between the salary of Kelvin and Alan when compared to the average. Imagine we have a new employee Addie with a salary of 25000 USD and then our new mean salary would be 5509.83 USD, but this isn't the case. We see except 1, everyone has their salary less than 2500 USD. So we can calculate the deviation from mean -
Employee Name | Salary (in USD) | Deviation (Abs) |
Jack | 1678.3 | 3831.533333 |
Alan | 2242.9 | 3266.933333 |
Kelvin | 998.8 | 4511.033333 |
Jake | 1938.6 | 3571.233333 |
Elly | 1200.4 | 4309.433333 |
Addie | 25000 | -19490.16667 |
We see there is a lot of deviation from the mean salary. Now how to sum this up in a single number?
Average won't work, because we have negative values here, so instead of normal averaging, we can square the numbers, add them, divide by the total number of samples, and then square root. This is called Standard Deviation.
Employee Name | Salary (in USD) | Deviation (Abs) | Deviation Sq. |
Jack | 1678.3 | 3831.533333 | 14680647.68 |
Alan | 2242.9 | 3266.933333 | 10672853.4 |
Kelvin | 998.8 | 4511.033333 | 20349421.73 |
Jake | 1938.6 | 3571.233333 | 12753707.52 |
Elly | 1200.4 | 4309.433333 | 18571215.65 |
Addie | 25000 | -19490.16667 | 379866596.7 |
Mean | 8726.343666 |
We can see here that there is so much deviation from the mean salary here..